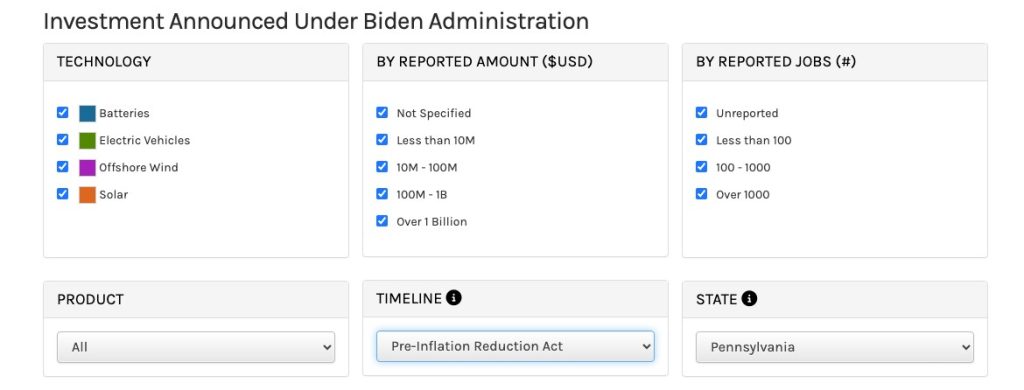
Check out this cool new interactive map that shows where and how clean energy manufacturing is mushrooming across the US.
Where the new US clean energy manufacturing is
The interactive map was created by the US Department of Energy (DOE) – check it out here – and you can filter by technologies (batteries, EVs, offshore wind, and solar), reported dollar amount, and reported number of jobs created. (I’d like to know why onshore wind isn’t included – I’ve reached out to the DOE to find out why and will update if I hear back.)
There’s a subsection that lets you narrow the technologies down to products, such as EV chargers or components. You can filter by state to see what’s happening in your neck of the woods, and as you zoom in, you can also see exactly what’s being made.

Since the start of the Biden administration, companies have announced more than 500 planned clean energy investments in at least 450 new or expanded clean energy manufacturing facilities, totaling over $160 billion in announced private and public sector investments.
There’s a filter for pre- and post-Inflation Reduction Act to see specifically what impact the law has had.
In Pennsylvania, for example, before the IRA’s passage, there was one company that made solar components, BCI Steel, which opened in June 2022:

Post-IRA, Pennsylvania now has five factories in the battery category, three in solar, and two EV charger manufacturers:

From 1 to 10 factories in just a couple of years is quite a jump, and Pennsylvania isn’t in the top 10 for growth. (Only 3 out of 10 in Pennsylvania reported their investment so far – the same with many other states – so the DOE points out that the investment dollars reported will significantly grow over time, overall.)
The state with the largest number of clean energy investment manufacturing announcements is California, boasting 52 investments totaling over $5 billion. You can check out the map to see the significant before-and-after in the Golden State.
Here’s the methodology the DOE used, if you’re interested.
Electrek’s Take
Are you wondering why I’m geeking out about some clickable government map? It’s because it shows what’s actually being done to electrify and reduce emissions in the US, the world’s second-largest emitter.
So when you’re feeling anxious about climate change or dread when you watch a hurricane hit California or New England (because no, that’s not normal), you can click on this map to see the genuine action being taken to combat climate change and grow the economy.
And yes, this clean energy growth is absolutely happening as a direct result of the Inflation Reduction Act. It’s a piece of legislation that’s created action, not just talk. The proof is on the map.
Read more: US renewables’ annual capacity additions to triple in 10 years – WoodMac
Photo: First Solar
If you’re considering going solar, it’s always a good idea to get quotes from a few installers. To make sure you find a trusted, reliable solar installer near you that offers competitive pricing, check out EnergySage, a free service that makes it easy for you to go solar. It has hundreds of pre-vetted solar installers competing for your business, ensuring you get high-quality solutions and save 20-30% compared to going it alone. Plus, it’s free to use, and you won’t get sales calls until you select an installer and share your phone number with them.
Your personalized solar quotes are easy to compare online, and you’ll get access to unbiased Energy Advisors to help you every step of the way. Get started here. –ad*
Read the full article here


